Key takeaway
Among the EU Sustainability Reporting Standards, ESRS E4 provides a list of metrics and indicators for biodiversity assessment. Pollen data from Onibi Watch can help with disclosure under §40 b (population size and range within specific ecosystems), §40 c (changes in the number of individuals of species within a specific area), as well as §41 b [ii] (multiple species within an ecosystem).
This is because pollen taken by honeybees reflects the diversity and density of flowering plants in their foraging area. By analysing the variety and distribution of pollen colours, this technology provides insights into local biodiversity and its variations over time, supporting sustainability reporting.
In the vast panorama of biomonitoring techniques, developing a technology for biomonitoring through hives is not only a way to assist the beekeeping profession with new means of income, but also a strategy to benefit from the specific advantages that monitoring the behaviour and the activities of this species can provide. Like all organisms within an ecosystem, honeybees can be effective bio-indicators, providing evidence of their health status (Farias et al., 2023). Morphological or physiological changes in the animal and the substances it touches, ingests, and collects can reveal multiple characteristics of its environment (Girotti et al., 2020). For different reasons, Apis mellifera is a highly suitable species for this task. Firstly, because of the thoroughness of the monitoring a honeybee colony allows, which is linked to its foraging activity. Between one-quarter and one-third (Ohlinger et al., 2024) of the average 20,000 bees in a hive carry out “several foraging trips per day (approximately 12-15 in their active period), covering an area of approximately 7 km2” (Mair et al., 2023). Although being more selective in foraging plants that are neither native nor near-native (de Vere et al., 2017), honeybees are defined as ‘polytectic’ pollinators, which means that they collect nectar and pollen from a wide array of flowering plants. Another feature is their effectiveness in sampling and storing ‘data’ from the surrounding environment, collecting “about ten million micro-samples of nectar and pollen per day” and accumulating them in the honeycombs grid (Mair et al., 2023). We can then gather information on plant diversity available to the honeybee indirectly by analysing pollen in honey (a practice called ‘melissopalynology’), directly from pollen grains on the bee’s hairs, from pollen stored in the comb (‘beebread’), or from pollen loads collected using traps placed at the hive entrance. In particular, this latter type of pollen “provides valuable spatial and temporal information of the botanical quality of the environment by means of the biodiversity of this pollen at the time of sampling”, thus constituting “the most practical direct assessment of pollen diversity” (Brodschneider et al., 2021).
Regarding the extraction of these data, the last decades have seen a significant shift from the analysis of honey samples or bee bodies in the laboratory to the widespread development, by professionals, makers, and amateurs, of minimally invasive acoustic sensors to be put inside the hives, weight sensors for their bases, and video cameras for their entrance (Ammar et al., 2019; Burma, 2023), together with temperature and humidity sensors (Ferrari et al., 2008; Meikle et al., 2017). This allows for a smoother and more immediate transition from the colony’s collected and produced data (such as its humming) to digital data processed through Machine-Learning techniques (Kulyukin et al., 2018; Zhao et al., 2021; Hadjur et al., 2022). Moreover, video cameras at the hive entrance, such as ‘Onibi Watch’ developed by Beefutures, can detect the status of the surrounding biodiversity by recognising and analysing the variety of colours of the pollen carried inside by the bees (Conti et al., 2016; Papa et al., 2022). Although the estimation of the number of pollen species is complicated by the fact that different plant species produce pollen of the same colour and that the same plant may produce pollen of several colours, it has been demonstrated a significant correlation between the number of pollen types visible through light microscopy and the variety we find through chromatic assessment. According to Brodschneider et al. (2021), this correlation “legitimates the determination of different colors in pollen samples as a simple measure for [pollen] diversity”. In turn, pollen diversity proves to be a robust and reliable indicator of floristic and landscape diversity (Matthias et al., 2015; Connor et al., 2021). For these reasons, and particularly when fed with a rich and continuous stream of time-specific data, technological tools for monitoring pollen diversity can effectively complement existing assessment techniques of plants’ biodiversity (Hornick et al., 2022).
To better define the term ‘plant biodiversity’, we can rely on DeLong’s (1996) definition of ‘biodiversity’ as “a state or attribute of a site or area and specifically refers to the variety within and among living organisms, assemblages of living organisms, biotic communities, and biotic processes, whether naturally occurring or modified by humans”. Despite the complexity of providing a reliable measuring of this factor, in recent years it has become “an obligatory component of many international agreements” (Hornick et al., 2022) and has been incorporated in existing sustainable frameworks requiring companies to report on their actual and possible interaction with biodiversity (Senanayake et al., 2024). These voluntary or mandatory disclosure requirements are also accompanied by “a positive trend toward biodiversity conservation” in the business domain, which is also motivated by investors considering this factor in their evaluation of where to direct their funds (Senanayake et al., 2024). Nevertheless, European Union legislation has driven a major advancement in promoting corporate environmental disclosures across Europe over the past decade, demonstrating the effectiveness of regulatory measures in improving the quality and quantity of such reporting (Charitou, 2022). A key milestone in this process was the adoption of the European Sustainability Reporting Standards (ESRS) in 2023, introduced under the Corporate Sustainability Reporting Directive (CSRD).
More specifically, among the different ESRS, the ESRS E4 concerns disclosure requirements about “biodiversity and ecosystems”. The objective of ESRS E4 is to ensure that enterprises gain a comprehensive understanding of their interactions with biodiversity and ecosystems, encompassing both positive and negative, actual and potential impacts. Additionally, it seeks to assess the financial implications for the enterprise over the short, medium, and long term, stemming from material risks and opportunities linked to its “impacts and dependencies on biodiversity and ecosystems”. From 2025 onwards, companies already subject to the ‘Non-Financial Reporting Directive (NFRD)’ are required to disclose their sustainability performance for the year 2024, so that “[t]he first companies will have to apply the standards in financial year 2024”. These companies must meet at least two conditions, namely, having more than 500 employees on average as of the balance sheet date and qualifying as public interest entities. From January 2026, the obligation to report on sustainability performance will extend to large European companies, which must report on their activities for the year 2025. From January 2027, the scope of these reporting requirements will expand further to include listed European small and medium-sized enterprises (SMEs), which will be required to report on their sustainability performance for 2026 (Lammerant et al., 2024).
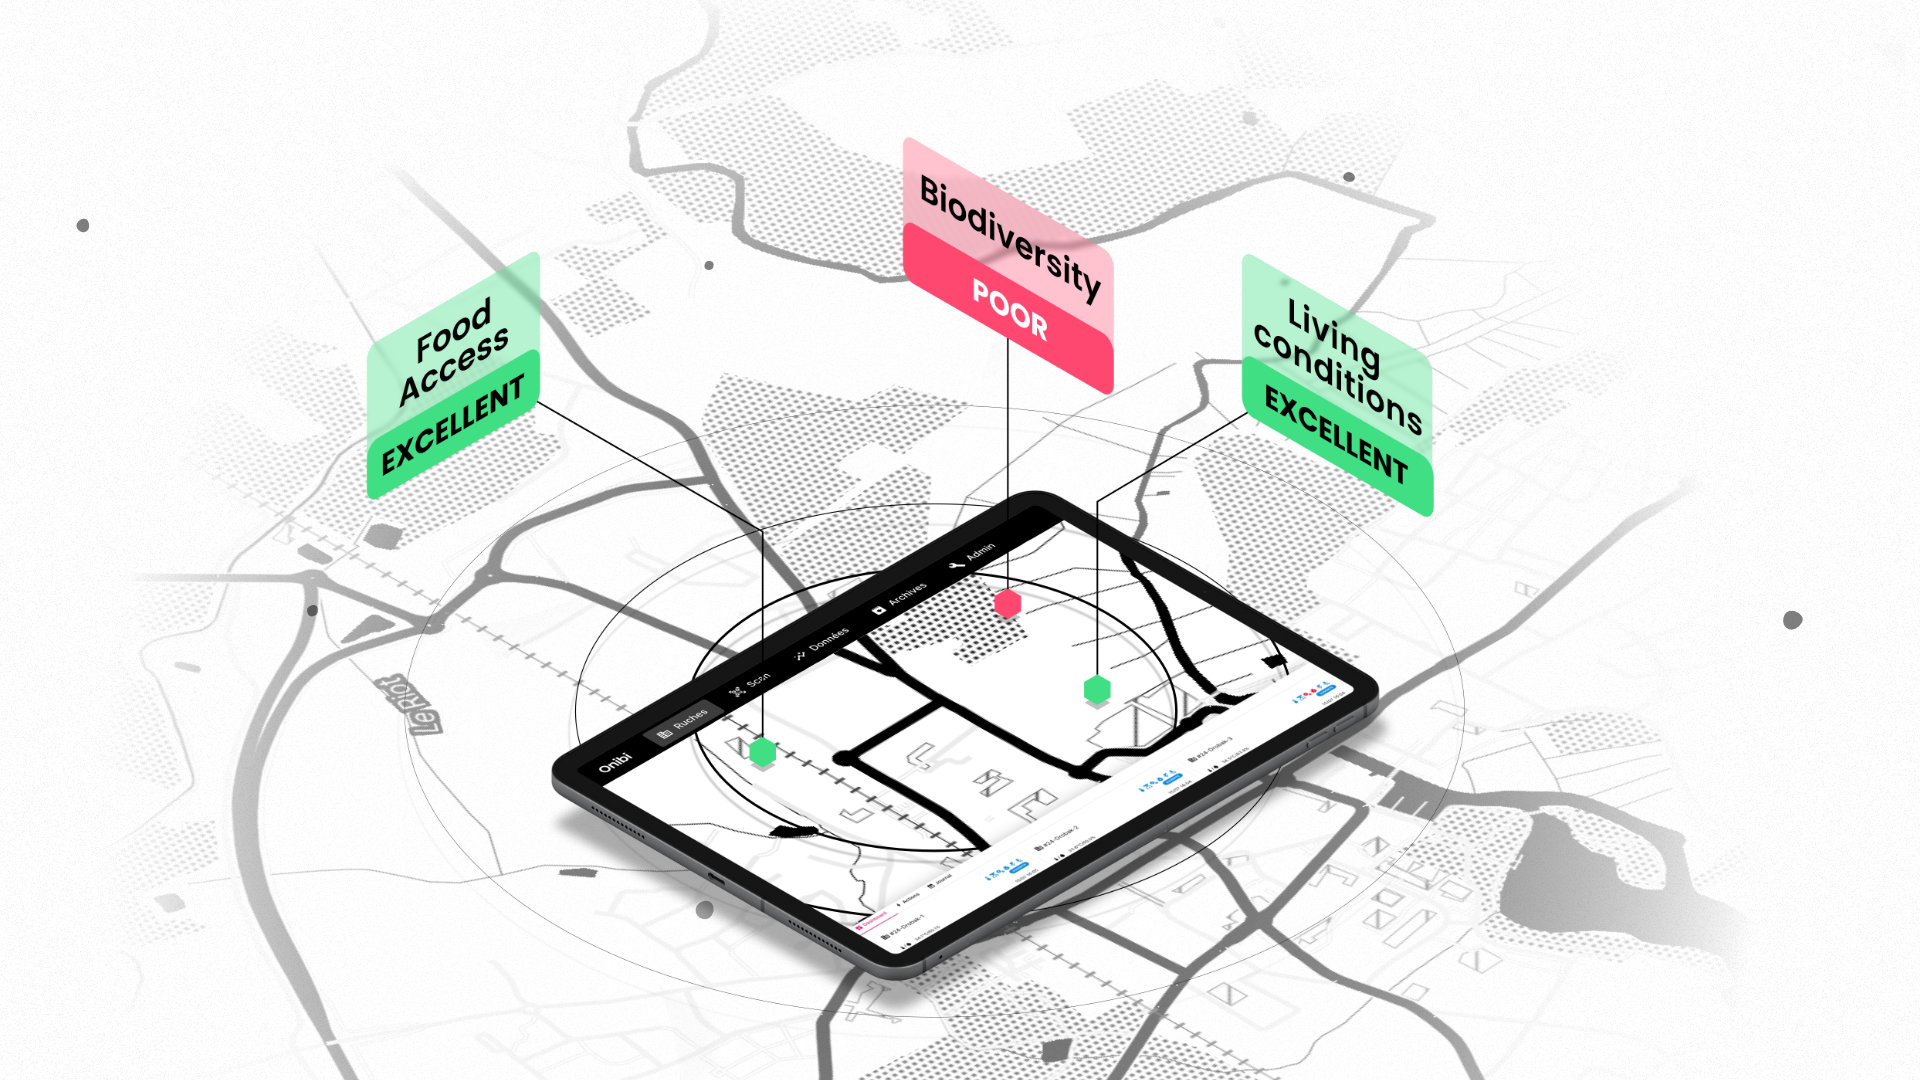
What distinguishes the ESRS from similar reporting standards is its “comprehensive and detailed consideration of sustainability issues and their impact on the company (outside-in perspective), as well the impact caused by the company (inside-out perspective) in conjunction with the requirement for continuous coordination and validation with relevant stakeholders”. The Global Reporting Initiative (GRI) and International Sustainability Standards Board (ISSB) sustainability standards, instead, focus, respectively, on the inside-out and outside-in perspectives. The GRI standards address the organisation’s environmental and societal impacts (GRI 2022), whereas the ISSB standards concentrate on climate-related financial risks and opportunities (Grunewald et al., 2024). In particular, ESRS E4 requires enterprises to disclose data concerning different aspects of their actual and potential interactions with biodiversity and ecosystems, and they list several metrics and indicators that should or may be adopted to this end. The metrics are derived from a list provided by EFRAG, a private association tasked with providing technical advice to the European Commission through the draft of EU Sustainability Reporting Standards or amendments to these Standards. Biomonitoring technologies using beehives could facilitate the assessment of a certain number of these metrics, none of which is considered, however, mandatory by the ESRS E4. In particular, they could help with the disclosure of “population size, range within specific ecosystems and extinction risk” (§40 b), of “changes in number of individuals of species within a specific area” (§40 c), and of “multiple species within ecosystem” (§41 b [ii]). Cameras supplemented with automated detection systems, such as those developed by Beefutures under the term ‘Onibi Watch’, together with data visualisation in reports and dashboards such as the ‘Onibi Insight’, offer metrics to measure these aspects by providing data concerning the pollen foraged by the honeybee colony. By plotting data collected by the cameras, the Onibi Insight platform can offer a ‘pollen diversity indicator’, which measures pollen diversity in terms of quantity, variety of colours, and their distribution. Considered on a year-long scale, this offers a reliable understanding of flowering plants’ density (§40 b) and variety in the area (§41 b [ii]) while measuring their change over the years (§40 c). Ad hoc improvements in camera-based monitoring systems could also allow the detection of specific “invasive alien species”, such as the Varroa mite (Varroa destructor) and the Asian hornet (Vespa velutina) to understand the “extent of surface” they cover by comparing data across biomonitoring hubs distributed over a large area. ESRS E4 mentions this aspect in Appendix A, §AR 32.
About the writer
Marco Innocenti is a researcher at Beefutures and a PhD candidate at the Panthéon-Sorbonne University and at the University of Milan, where he is part of “PhilTech – Research Center for the Philosophy of Technology”. He is a Visiting PhD candidate at the Philosophy Group at Wageningen University and Research (NL), among the world leaders in Agricultural and Environmental Sciences.
In his doctoral thesis in Ethics of Technology, he investigates how the possibilities opened up by AI-driven automation in beekeeping redefine the role and concept of ‘nature’ in Responsible Innovation. This reflection aims to indicate guidelines for ethical innovation in AgriTech R&D labs. In this series of articles, he summarizes his research for the interest of experts and enthusiasts in this field.